
LOUISVILLE, Ky. — WHAS11 has launched a new project, bringing you context around the numbers and analysis that gives the numbers more meaning. We are using the daily numbers to make graphs and then working with experts to decipher them.
Dr. Ruth Carrico with U of L School of Medicine said, "Dealing with coronavirus is our new normal and will continue to be our new normal for the foreseeable and maybe even the unforeseeable future. So each of us needs to know what that means to us, how that information is conveyed- is very much an art and very important for us in the community to use and act on."

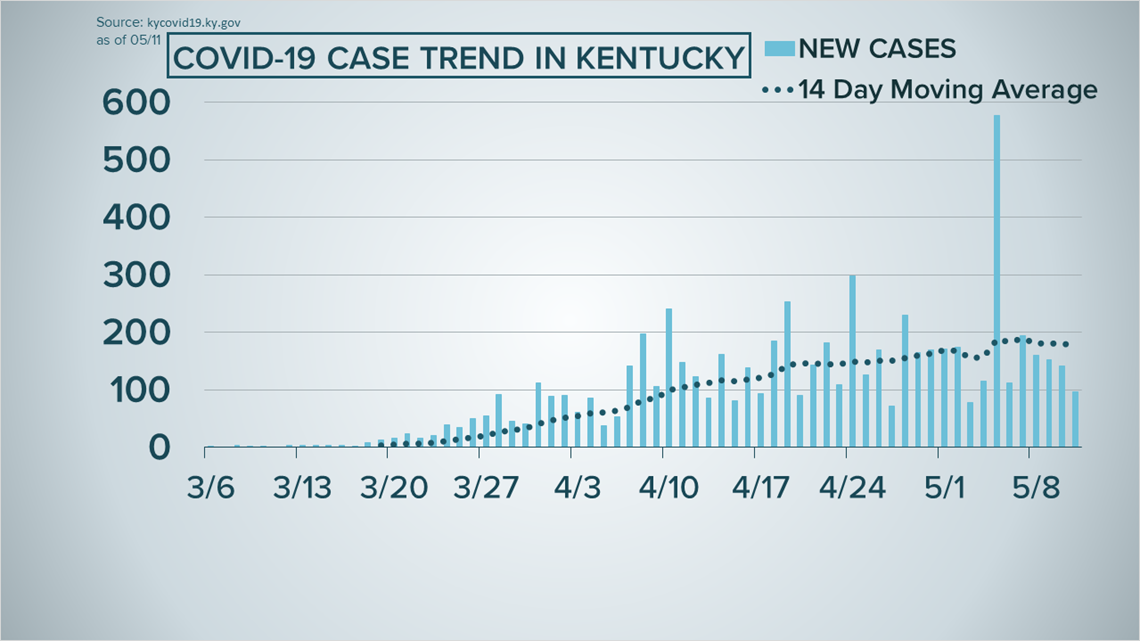
This is the Kentucky new case trend map. The spike you see was the big headline of last week, when 309 new cases were reported at the Green River Correctional Facility after everyone there was tested for the virus.
Looking at the overall trend, according to our expert this graph shows Kentucky's case load is still slowly growing, only starting to plateau over the last few days.

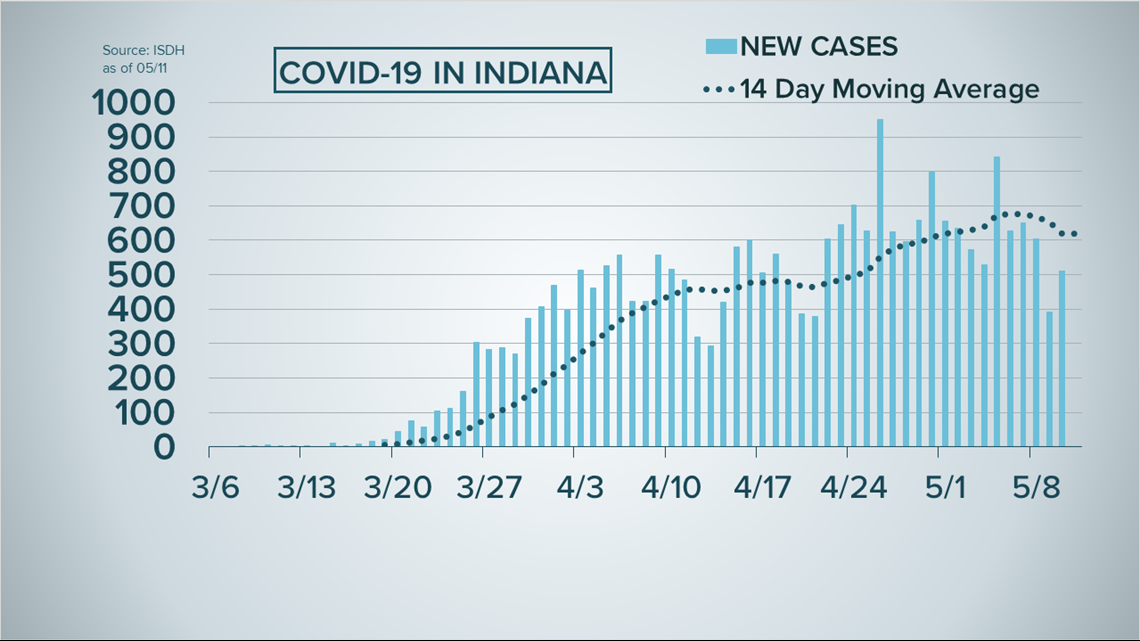
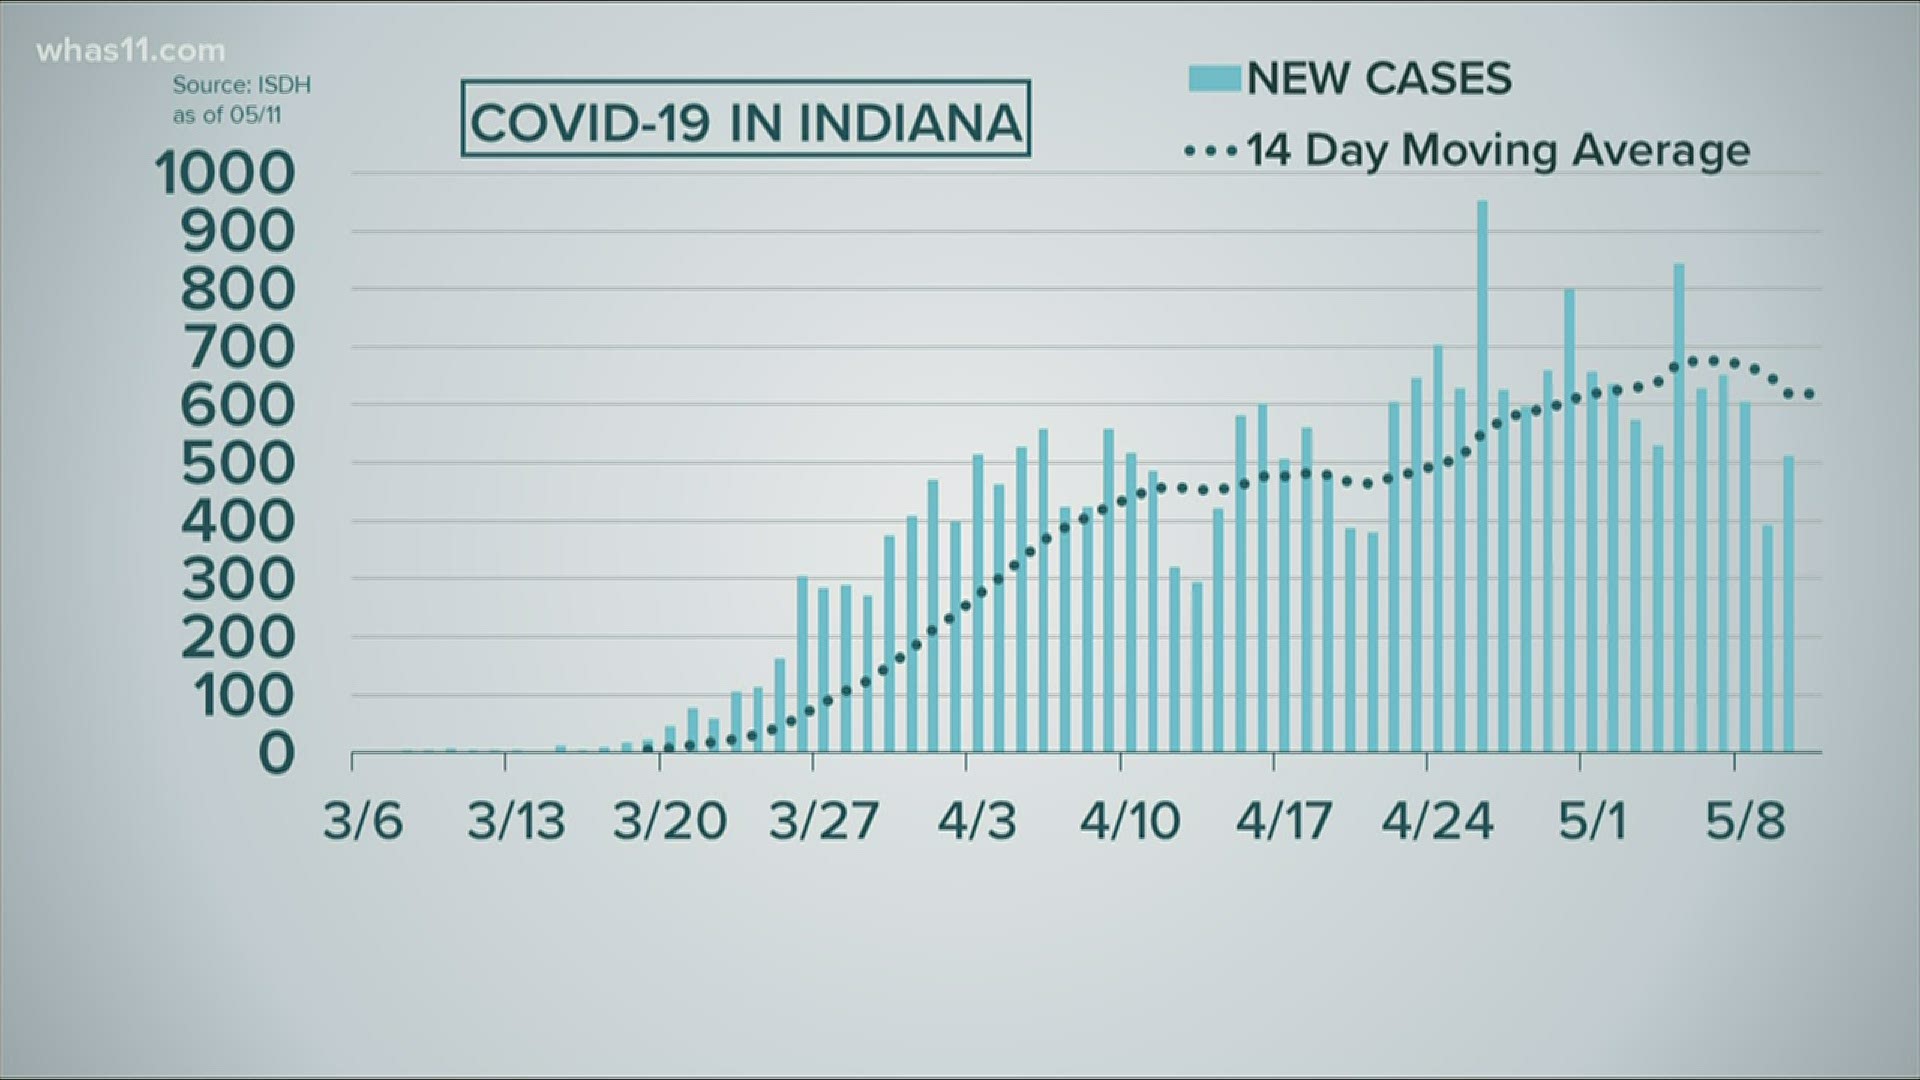
This map shows the new case trend line in Indiana. Seven days into Indiana's staged re-opening plan we have some good news, the reported new number of cases each day is starting to plateau. If you look at the dotted line- that's what we call the 14 day average. It tells us we aren't yet seeing a decline but we are seeing movement in the right direction. The line appears to flatten out over the last week.

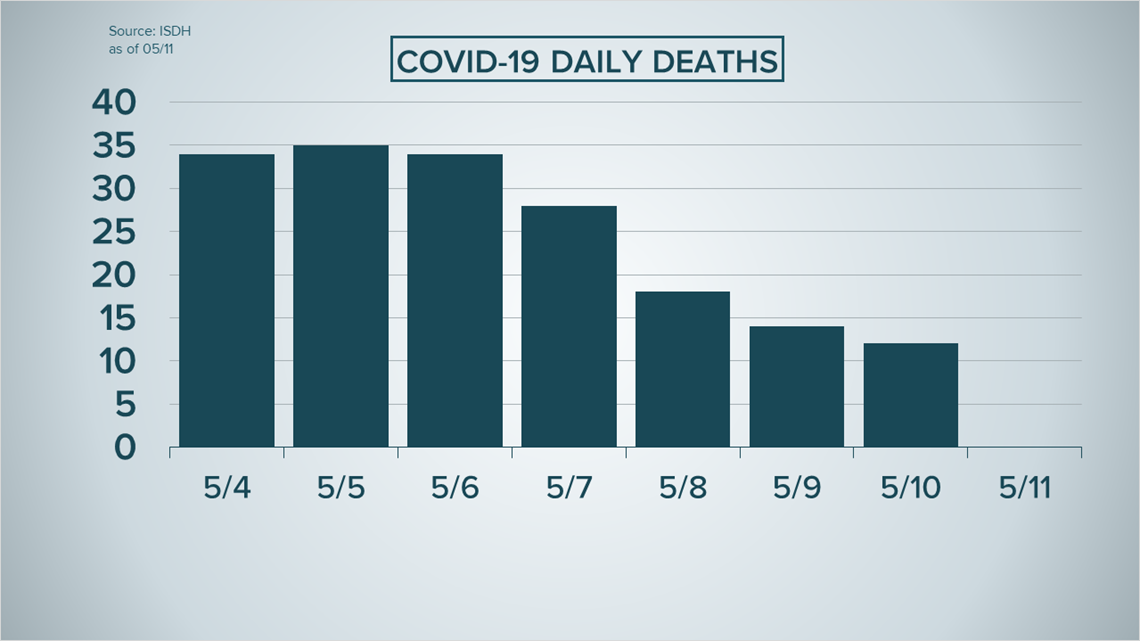
The above bar graph show the number of deaths reported in Indiana since last Monday, when the state started re-opening malls and allowing social gatherings. If we can take something positive from this chart, its that we have been reporting fewer and fewer new deaths in Indiana over the past seven days.
But we have to keep an eye on this graph, and the others in Indiana, as the stages of re-opening continue to loosen restriction. Carrico said these graphs are more representative of what the disease looked like two weeks ago than what it looks like right now and two weeks ago remember most businesses were still closed.
►Contact reporter Shay McAlister at smcalister@whas11.com. Follow her on Twitter (@WHAS11Shay) and Facebook.
►Make it easy to keep up-to-date with more stories like this. Download the WHAS11 News app now. For Apple or Android users.
Have a news tip? Email assign@whas11.com, visit our Facebook page or Twitter feed.
MORE ON WHAS11.COM
- Real-time updates: Gov. Andy Beshear asks Kentuckians to pray for 10-year-old who's on ventilator from COVID-19
- Pet groomers reopen to high demand, new safety precautions
- Poll: Majority disapprove of coronavirus protests
- Beshear: Masks, face coverings encouraged starting May 11
- Senator calls on VA to explain use of unproven drug on veterans