
LOUISVILLE, Ky. — We may be over the virus but the pandemic is not over.
The FOCUS team is committed to giving you more than just the numbers but also the context to understand what they mean to you and your family.
KENTUCKY

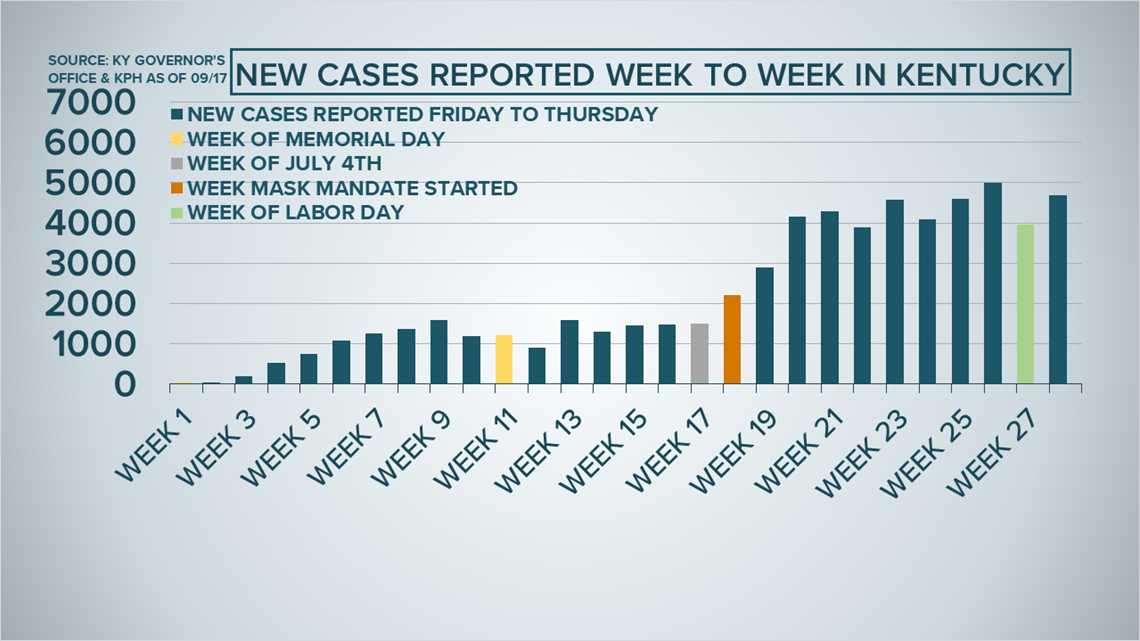
This graph shows the total of new cases per week in Kentucky. We have color-coded weeks with holidays for reference. The week the mask mandate started is marked by the orange bar.
You'll notice case counts ramp up one to two weeks after each holiday. You will also notice the highest case count on record was the week right before Labor day -- the third bar from the far right.
Although new cases since Kentuckians masked up have increased, the ups and downs week to week seem to be showing new cases are leveling out instead of continuing to climb.
INDIANA

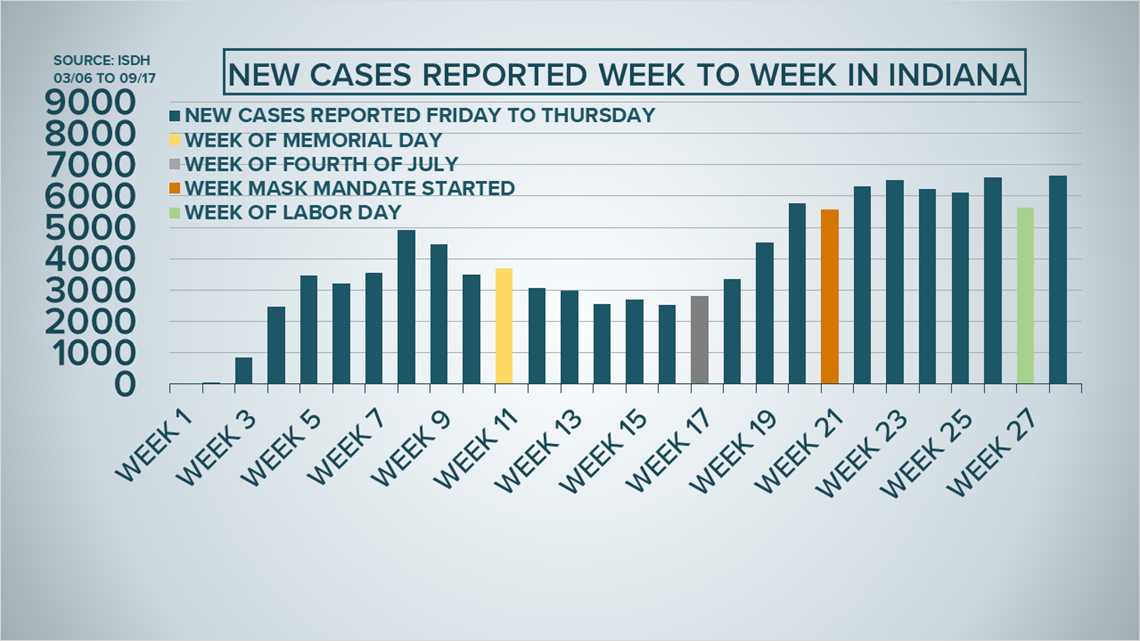
This graph is similar but shows cases counts by week in Indiana. Unlike, Kentucky cases seem to drop after the Memorial Day Holiday -- that's the yellow bar.
By the Fourth of July, week 17 shown in grey, cases hit a steady increase week after week.
Governor Eric Holcomb put in place a mask mandate at the end of July, marked in orange.
The final bar on the far right marks the week ending on September 17 and the total new cases hit the highest point yet.
As the weeks go by we will continue to watch to see these trends and more.
►Make it easy to keep up-to-date with more stories like this. Download the WHAS11 News app now. For Apple or Android users.
Have a news tip? Email assign@whas11.com, visit our Facebook page or Twitter feed.