
LOUISVILLE, Ky. — There is no doubt in the data, we are seeing an increase in COVID-related deaths.
Our FOCUS team has some graphs to show you that trend.
Before we get into the numbers we want to take a moment to remember -- these are brothers and sisters, parents and grandparents.
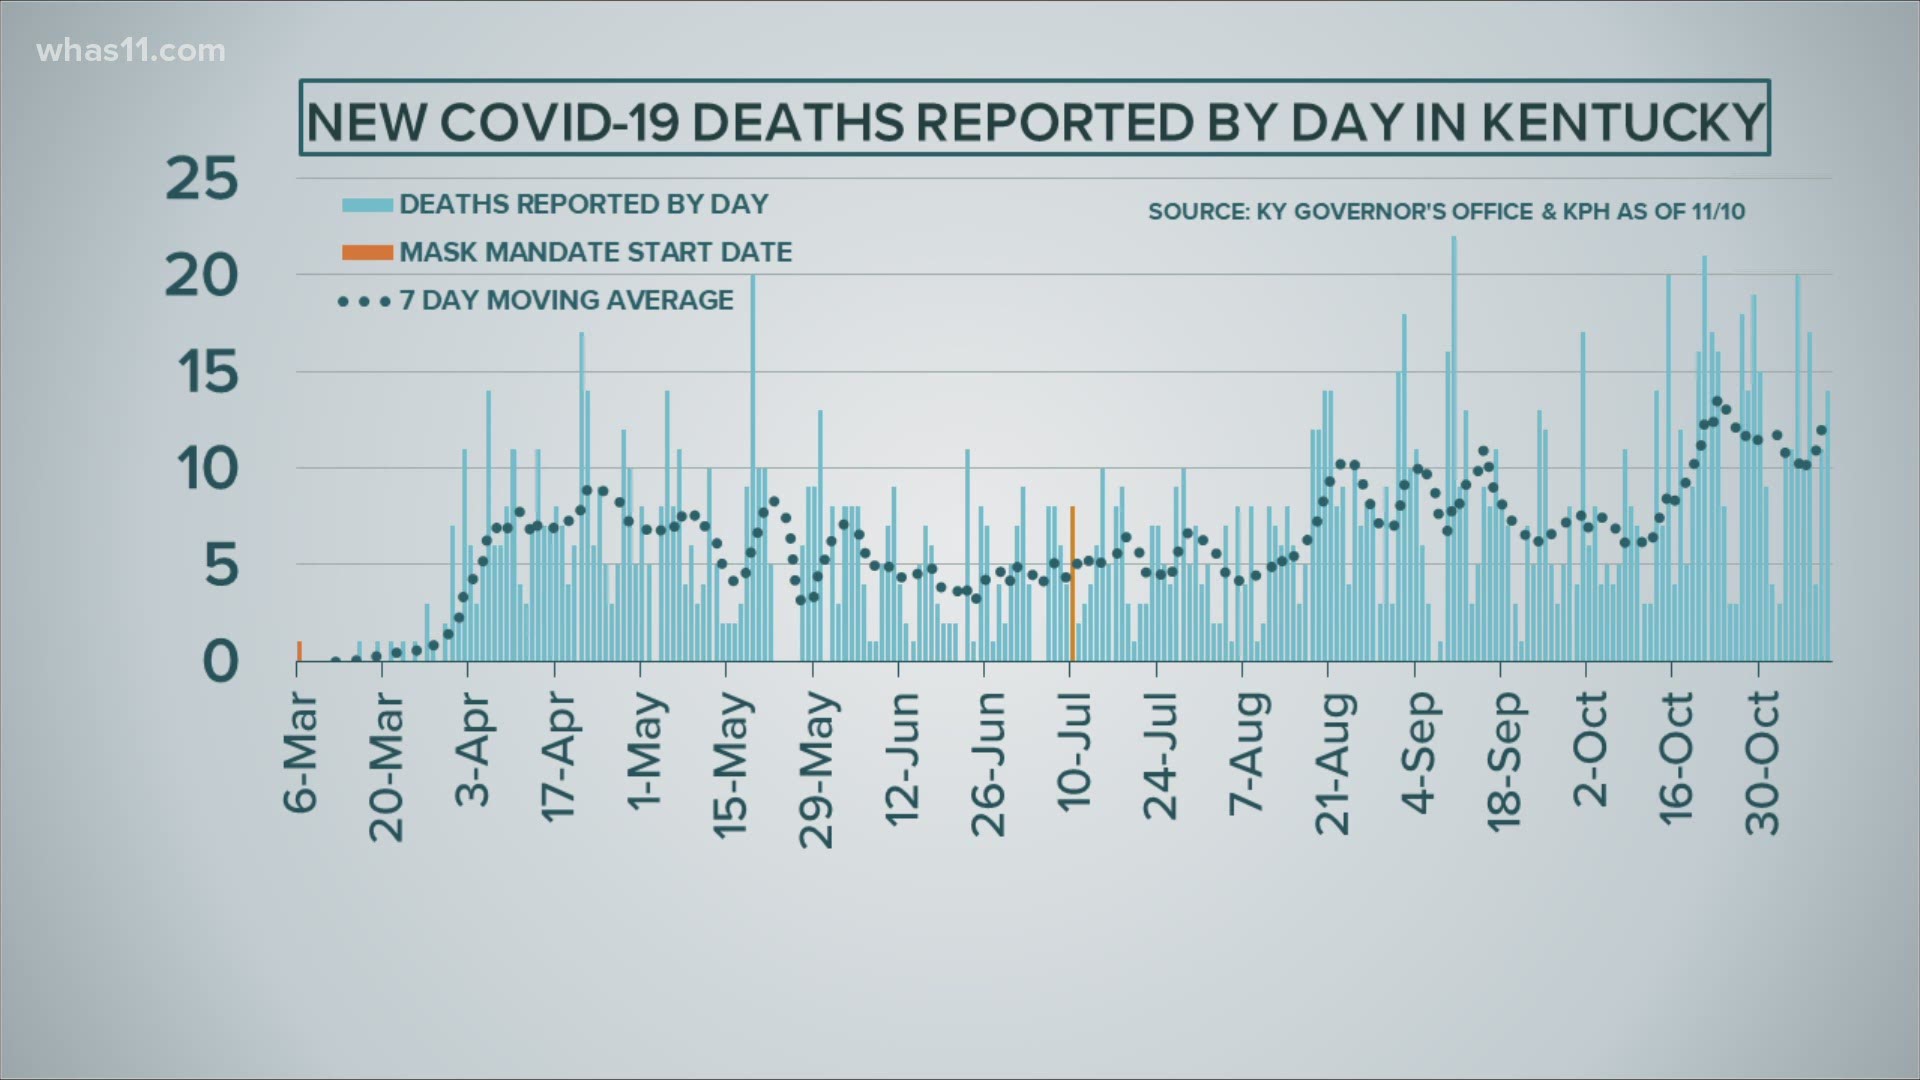
KENTUCKY

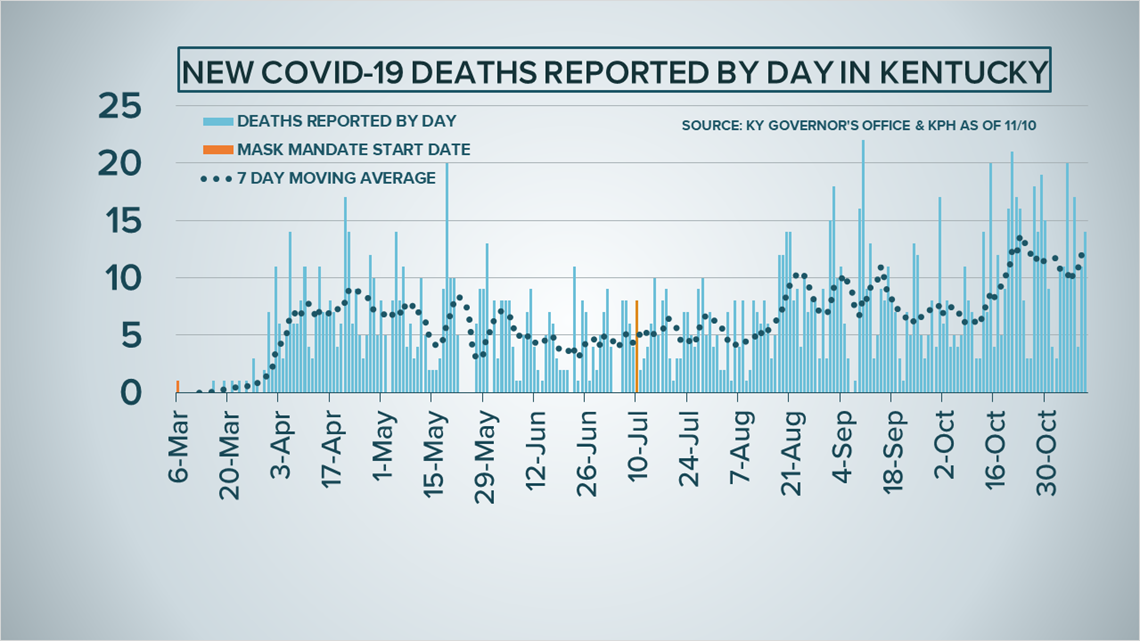
Each bar rises to mark the number of deaths reported each day
Moving from March on the left to November on the right, you'll notice in October the dotted trend line takes a sharp trip upward.
At the far right, you can see we continue to see a large number of lives lost.
While that trend line has dipped a bit, it appears to be leveling out at a high rate.
INDIANA

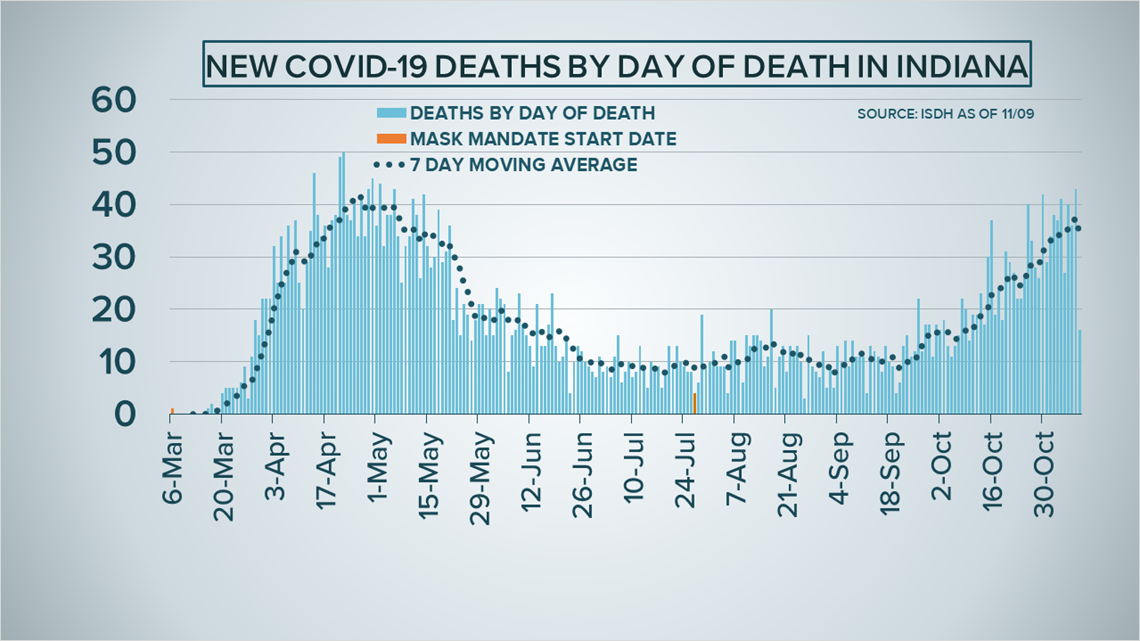
In comparison to Kentucky, there have been more deaths in Indiana. Indiana also has a great population.
Notice the numbers on the axis on the left side are higher.
Each bar rises to show the number of deaths by day.
Follow that dotted trend line to the right, you can see deaths started to trend up in September.
In October, deaths continued to climb.
So far, in November, there is no sign of decline.
With the holidays right around the corner, we'll keep tracking these trends so you can make decisions for your family.
►Make it easy to keep up-to-date with more stories like this. Download the WHAS11 News app now. For Apple or Android users.
Have a news tip? Email assign@whas11.com, visit our Facebook page or Twitter feed.